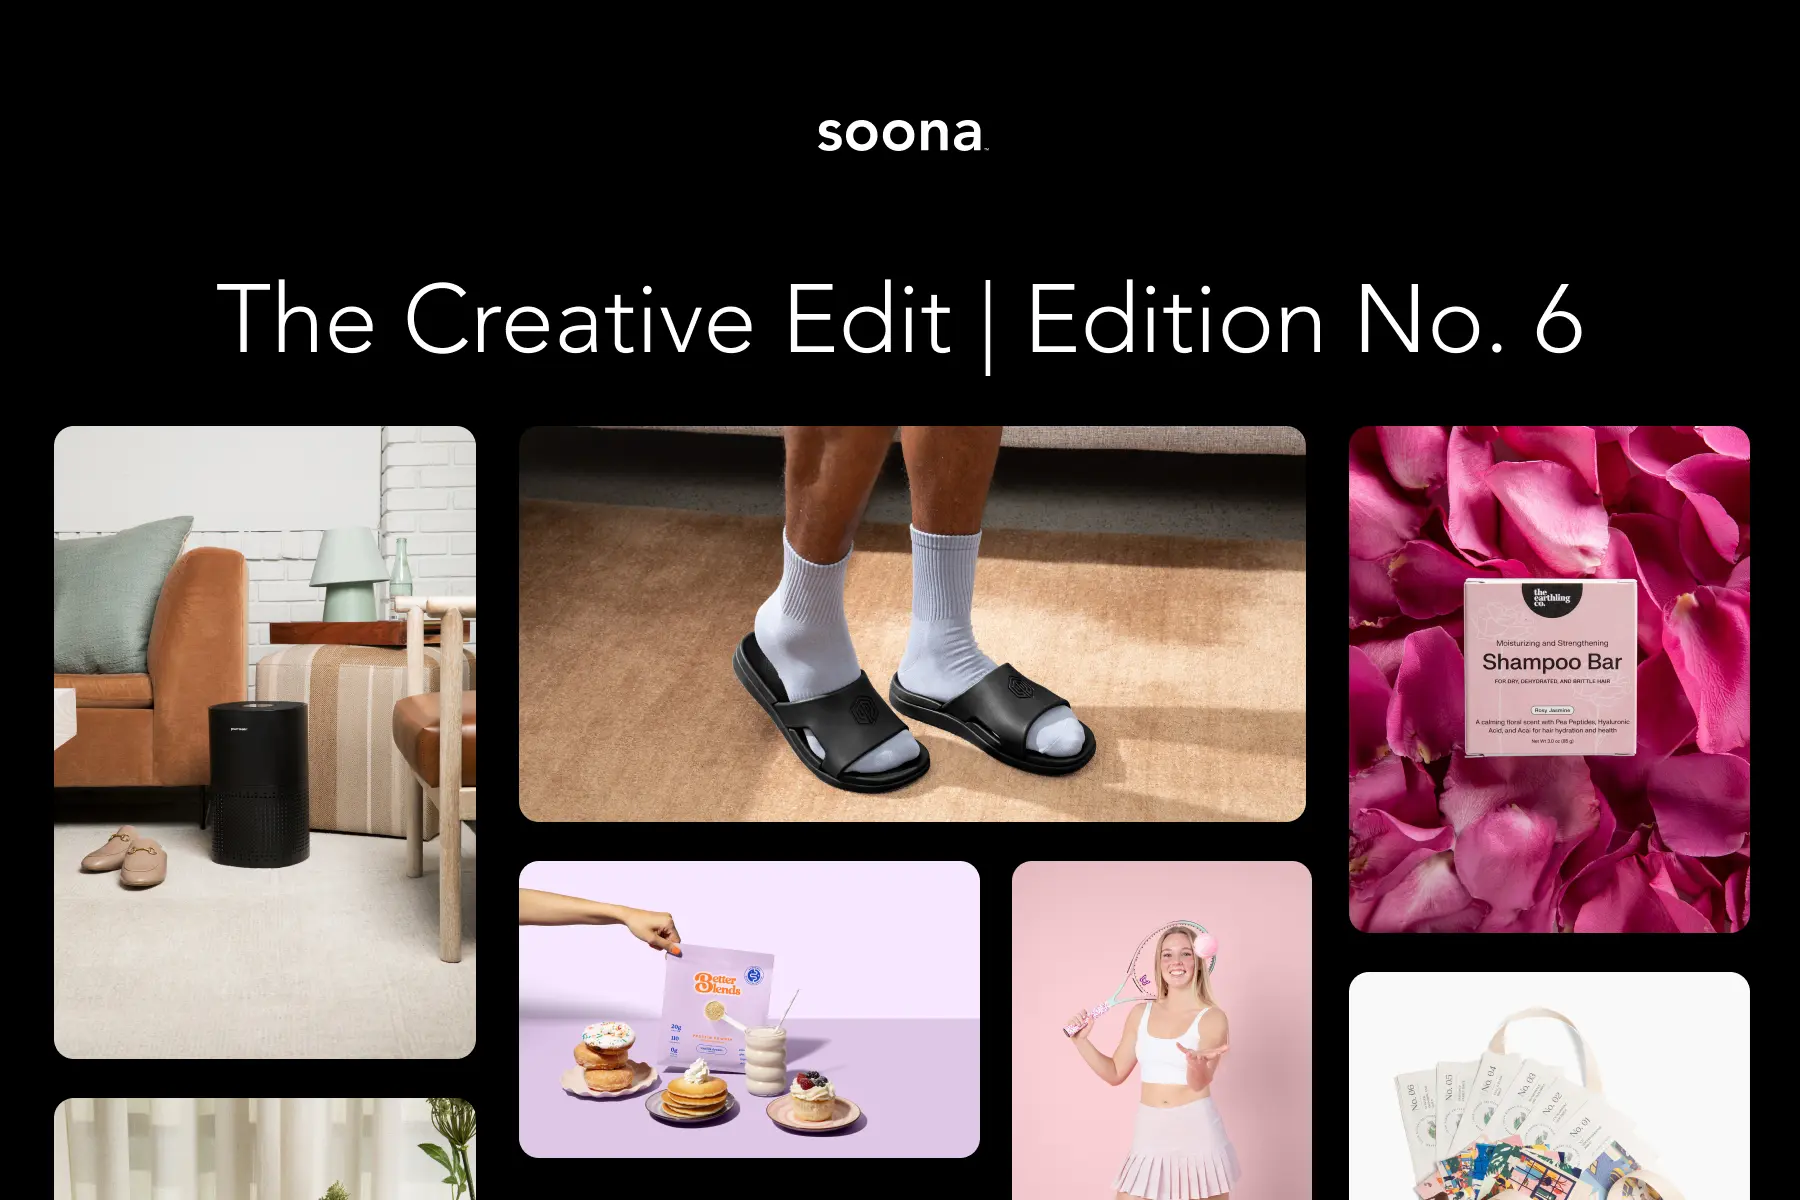
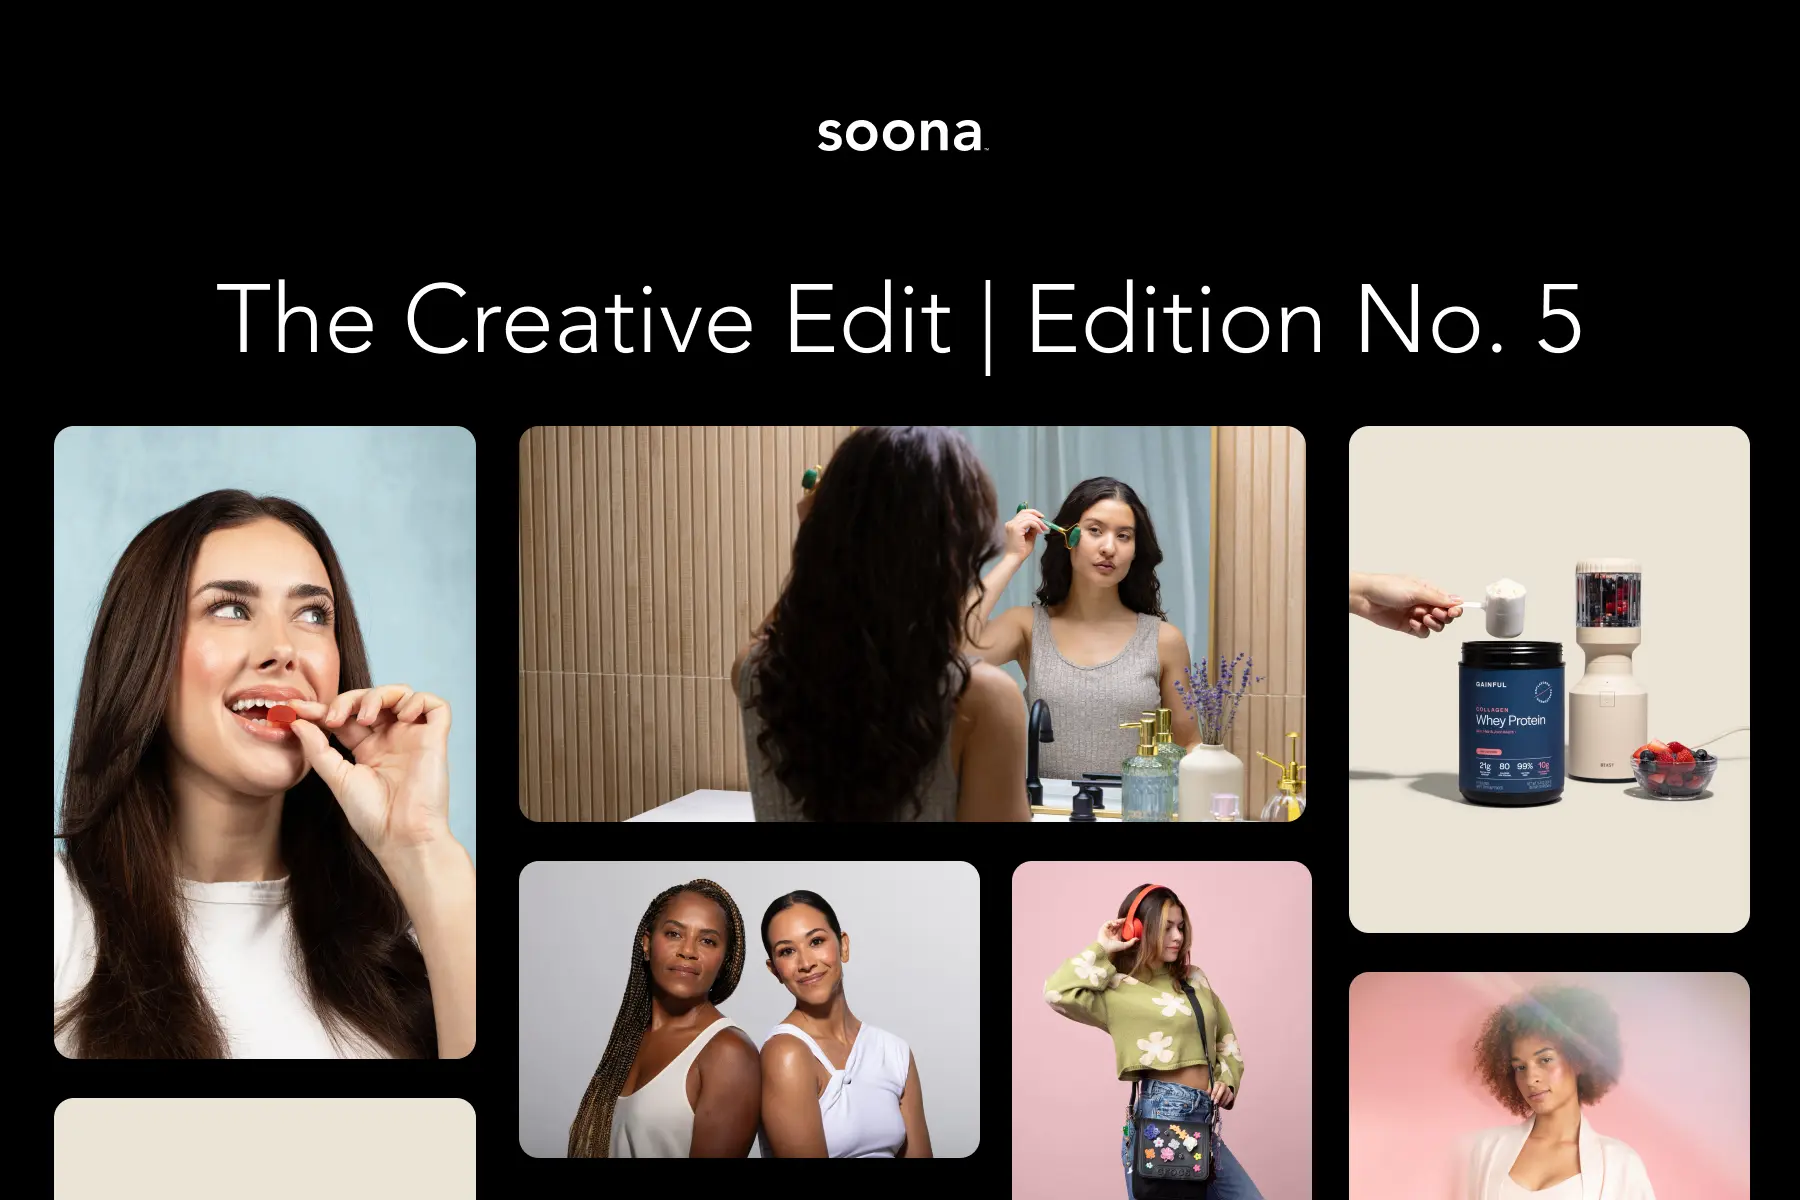
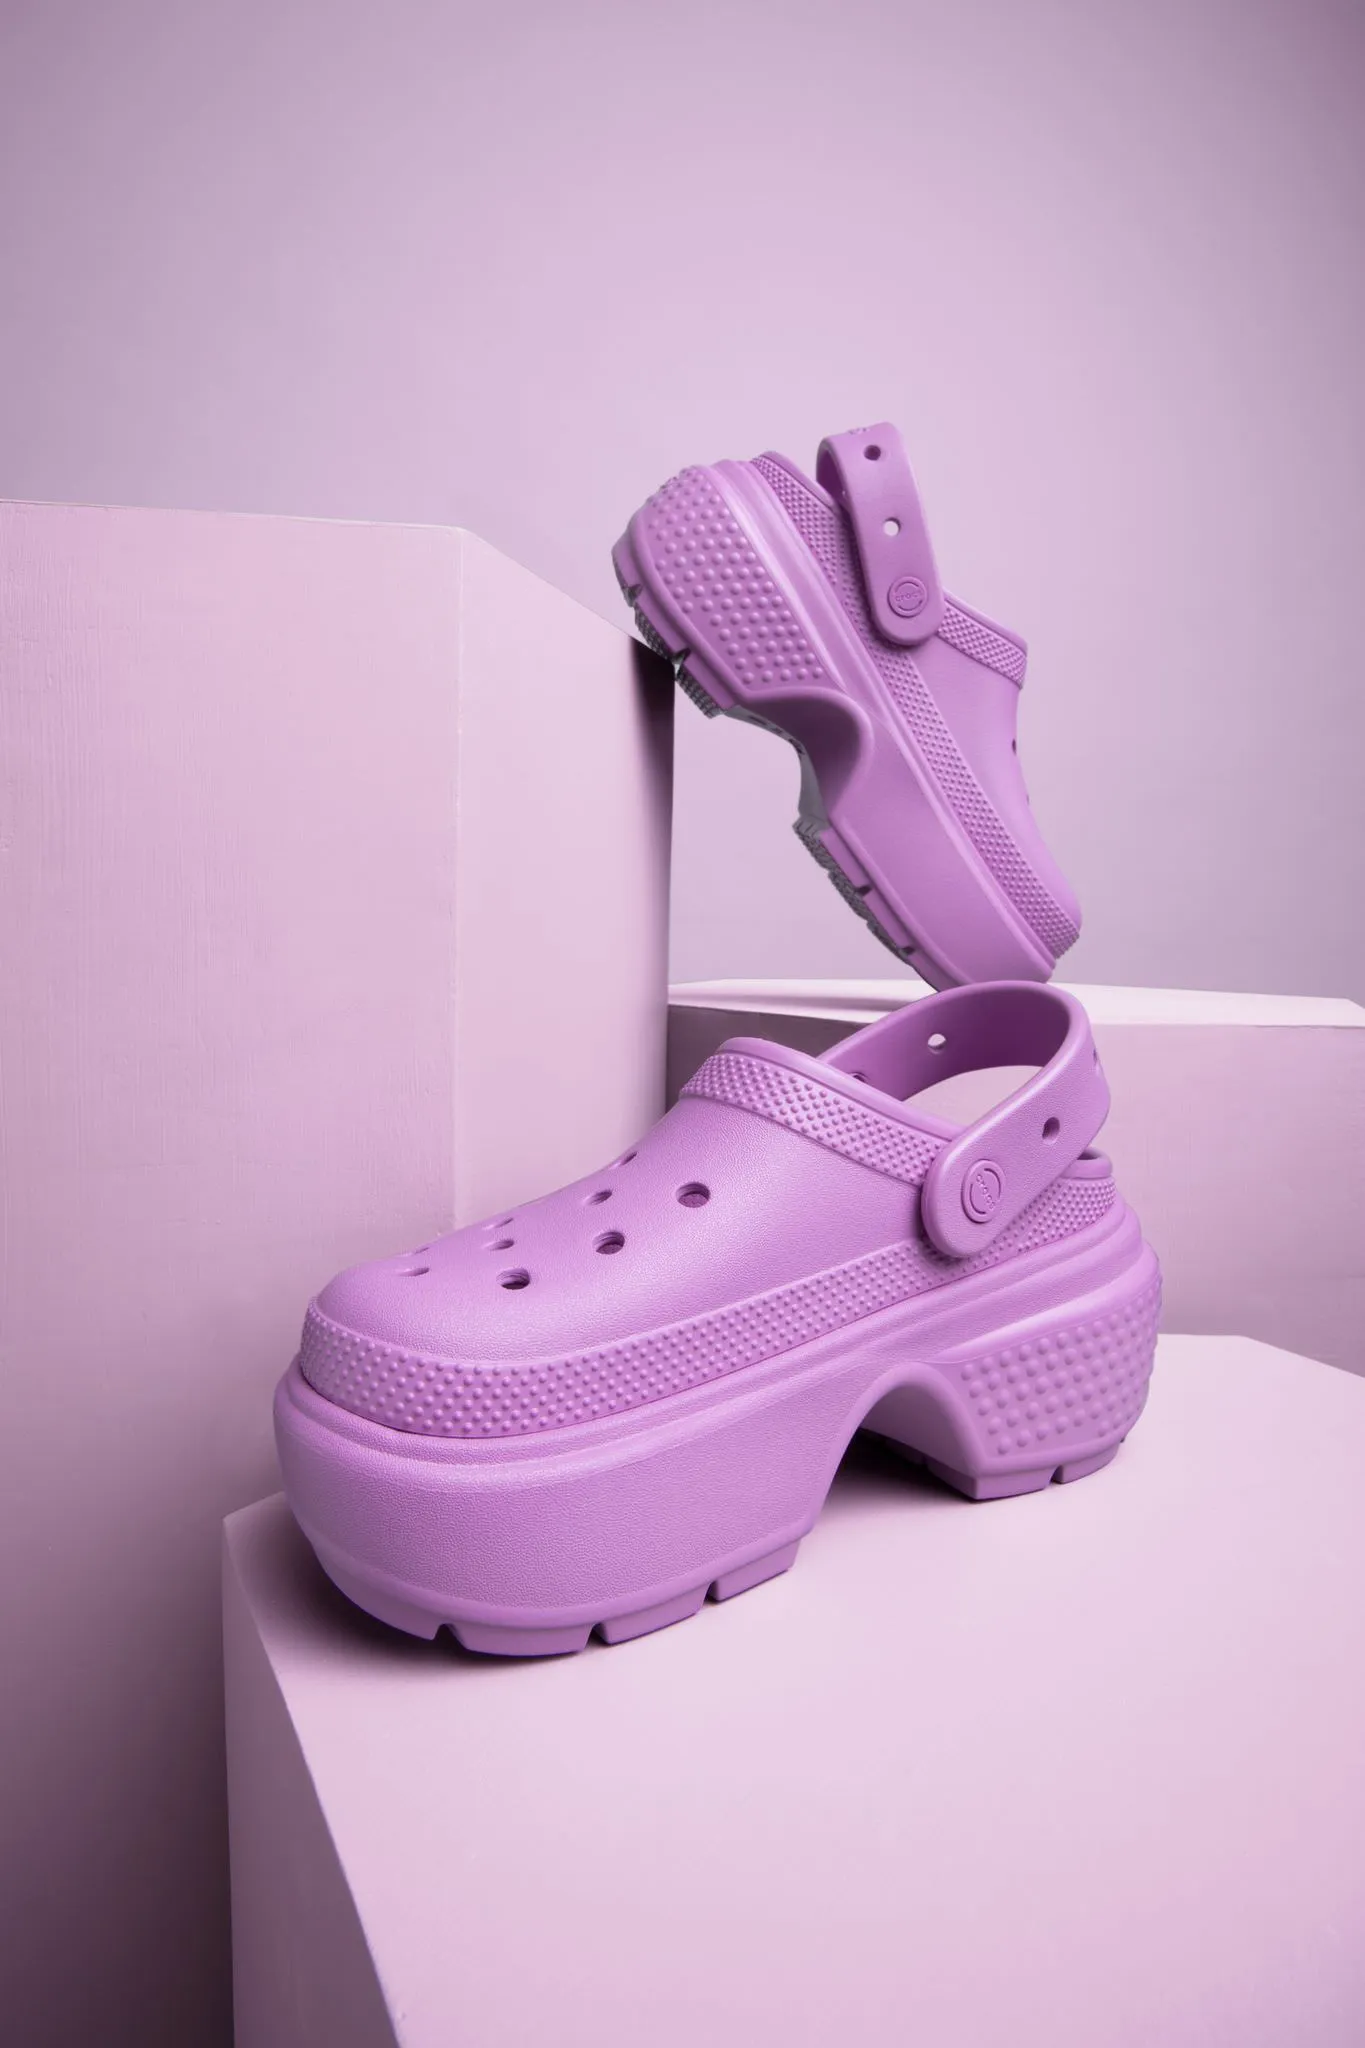
We live in a visual world. Often when it comes to sales, product images are more important than product titles, descriptions, or even reviews. And that’s because photos are really what bring a product to life.
Product photos are key at each stage of the purchase cycle:
Stage 1: Your customer is first introduced to your brand through an ad on social media.
Stage 2: They visit your ecomm site. one product photo turns into six or seven shots taken from various angles with multiple props.
Stage 3: Your customer makes a purchase and your product arrives at their doorstep.
Stage 4: They take a photo and post it online. The cycle begins again.
Product images are truly a must-have for your brand. So how much of an investment should your brand make in its photos? Here are a few ways to measure the quality and impact of your product photos:
Check soona Listing Insights
Listing Insights is a visual analytics tool for your Amazon store—a first-of-its kind platform designed to optimize the visuals you use to sell your products.

Here’s how it works:
Connect your Amazon storefront with soona’s measurement dashboard. The AI tool will instantly analyze and measure your creative assets. It will then provide targeted creative recommendations to improve your product listings performance.
Your visual performance score is an overall measure of how well your listing’s images match Amazon’s best practices and guidelines. This score breaks down into three parts:
- Image quality: Do your image files meet the standard for technical and production quality?
- Gallery count: Does your gallery or carousel have Amazon’s recommended image count of at least six images?
- Visual mix: Does your listing use an optimal variety of content types, like product videos and animated GIFs?
Listing Insights only supports Amazon at the moment, but we’re actively working to connect to other ecommerce platforms.
Reverse-engineer your customer acquisition costs
We already know that better images never fail to increase sales. But by how much?
One way to determine how much you can spare on additional visuals is by measuring how your customer acquisition costs (or CAC) changes when you improve the quality of the photos in your brand’s social media posts.
Let’s say your CAC started at $100. But you just posted a string of all-new photos featuring your most popular product on Instagram and your CAC dropped to $80. This is an indication of how much money you’ll save if you choose to invest in better images across your brand.
Take the number of customers you hope to acquire + multiply it by your savings (in this case, $20 per customer). voilá—you have a sustainable budget for new visuals.
Use product sales goals as a guide
You can also use product sales goals to determine how much to spend on images.
Let’s say you were previously selling $50,000 in a product and you’re hoping to sell $100,000 in a new product. Take the difference and multiply it by 0.25 (or 25%).
This will give you a general sense of the visual budget you should be aiming for.
Get product images that convert
The bottom line? Don’t skimp on excellent images. Remember, product photos are the most important decision-making item on your customer’s list and your visual budget should reflect that.
{{studio-ad}}
We live in a visual world. Often when it comes to sales, product images are more important than product titles, descriptions, or even reviews. And that’s because photos are really what bring a product to life.
Product photos are key at each stage of the purchase cycle:
Stage 1: Your customer is first introduced to your brand through an ad on social media.
Stage 2: They visit your ecomm site. one product photo turns into six or seven shots taken from various angles with multiple props.
Stage 3: Your customer makes a purchase and your product arrives at their doorstep.
Stage 4: They take a photo and post it online. The cycle begins again.
Product images are truly a must-have for your brand. So how much of an investment should your brand make in its photos? Here are a few ways to measure the quality and impact of your product photos:
Check soona Listing Insights
Listing Insights is a visual analytics tool for your Amazon store—a first-of-its kind platform designed to optimize the visuals you use to sell your products.

Here’s how it works:
Connect your Amazon storefront with soona’s measurement dashboard. The AI tool will instantly analyze and measure your creative assets. It will then provide targeted creative recommendations to improve your product listings performance.
Your visual performance score is an overall measure of how well your listing’s images match Amazon’s best practices and guidelines. This score breaks down into three parts:
- Image quality: Do your image files meet the standard for technical and production quality?
- Gallery count: Does your gallery or carousel have Amazon’s recommended image count of at least six images?
- Visual mix: Does your listing use an optimal variety of content types, like product videos and animated GIFs?
Listing Insights only supports Amazon at the moment, but we’re actively working to connect to other ecommerce platforms.
Reverse-engineer your customer acquisition costs
We already know that better images never fail to increase sales. But by how much?
One way to determine how much you can spare on additional visuals is by measuring how your customer acquisition costs (or CAC) changes when you improve the quality of the photos in your brand’s social media posts.
Let’s say your CAC started at $100. But you just posted a string of all-new photos featuring your most popular product on Instagram and your CAC dropped to $80. This is an indication of how much money you’ll save if you choose to invest in better images across your brand.
Take the number of customers you hope to acquire + multiply it by your savings (in this case, $20 per customer). voilá—you have a sustainable budget for new visuals.
Use product sales goals as a guide
You can also use product sales goals to determine how much to spend on images.
Let’s say you were previously selling $50,000 in a product and you’re hoping to sell $100,000 in a new product. Take the difference and multiply it by 0.25 (or 25%).
This will give you a general sense of the visual budget you should be aiming for.
Get product images that convert
The bottom line? Don’t skimp on excellent images. Remember, product photos are the most important decision-making item on your customer’s list and your visual budget should reflect that.
{{studio-ad}}


